Explori
Navigation
Legal
Client Login

Your survey results, presented. In minutes, not days.

SlidePal is our new presentation automation tool, built into Explori. It turns your survey results into a finished, benchmarked deck, with no manual analysis and no chart building by hand.

SlidePal interface
◐Every question, one click
▲Commentary on every data slide
✦Both audiences, one deck
◎Benchmarked in context
◐Every question, one click
▲Commentary on every data slide
✦Both audiences, one deck
◎Benchmarked in context
The Problem

Why it matters

Too often, survey results never reach the people setting strategy in a form they take seriously. Building that deck takes hours of analysis few event teams have to spare.

The traditional way
1Export the results from each survey
2Line up this year against last year
3Work out in Excel what's worth charting
4Build each chart in PowerPoint
5Write the commentary and a summary
6Do it all again for the next event
1 to 2 days, every time
With SlidePal
1Select your event and surveys
2Choose your charts and layout
3Generate the deck and commentary
Next time: Another event? Reuse the structure.
SlidePal slide 1
SlidePal slide 2
SlidePal slide 3
Ready to present
Executed in minutes
Greg Topalian, Opus Origin and former Chairman of Clarion North America
“
One of the biggest challenges facing event teams is time-to-insight: getting actionable findings from their last event into the hands of decision-makers quickly. I’ve never seen a solution that achieves this as elegantly and rapidly as SlidePal.
Greg Topalian, Opus Origin and former Chairman of Clarion North America

Read the launch announcement

What it does

Build a story, not slides

Question Library

Choose what matters

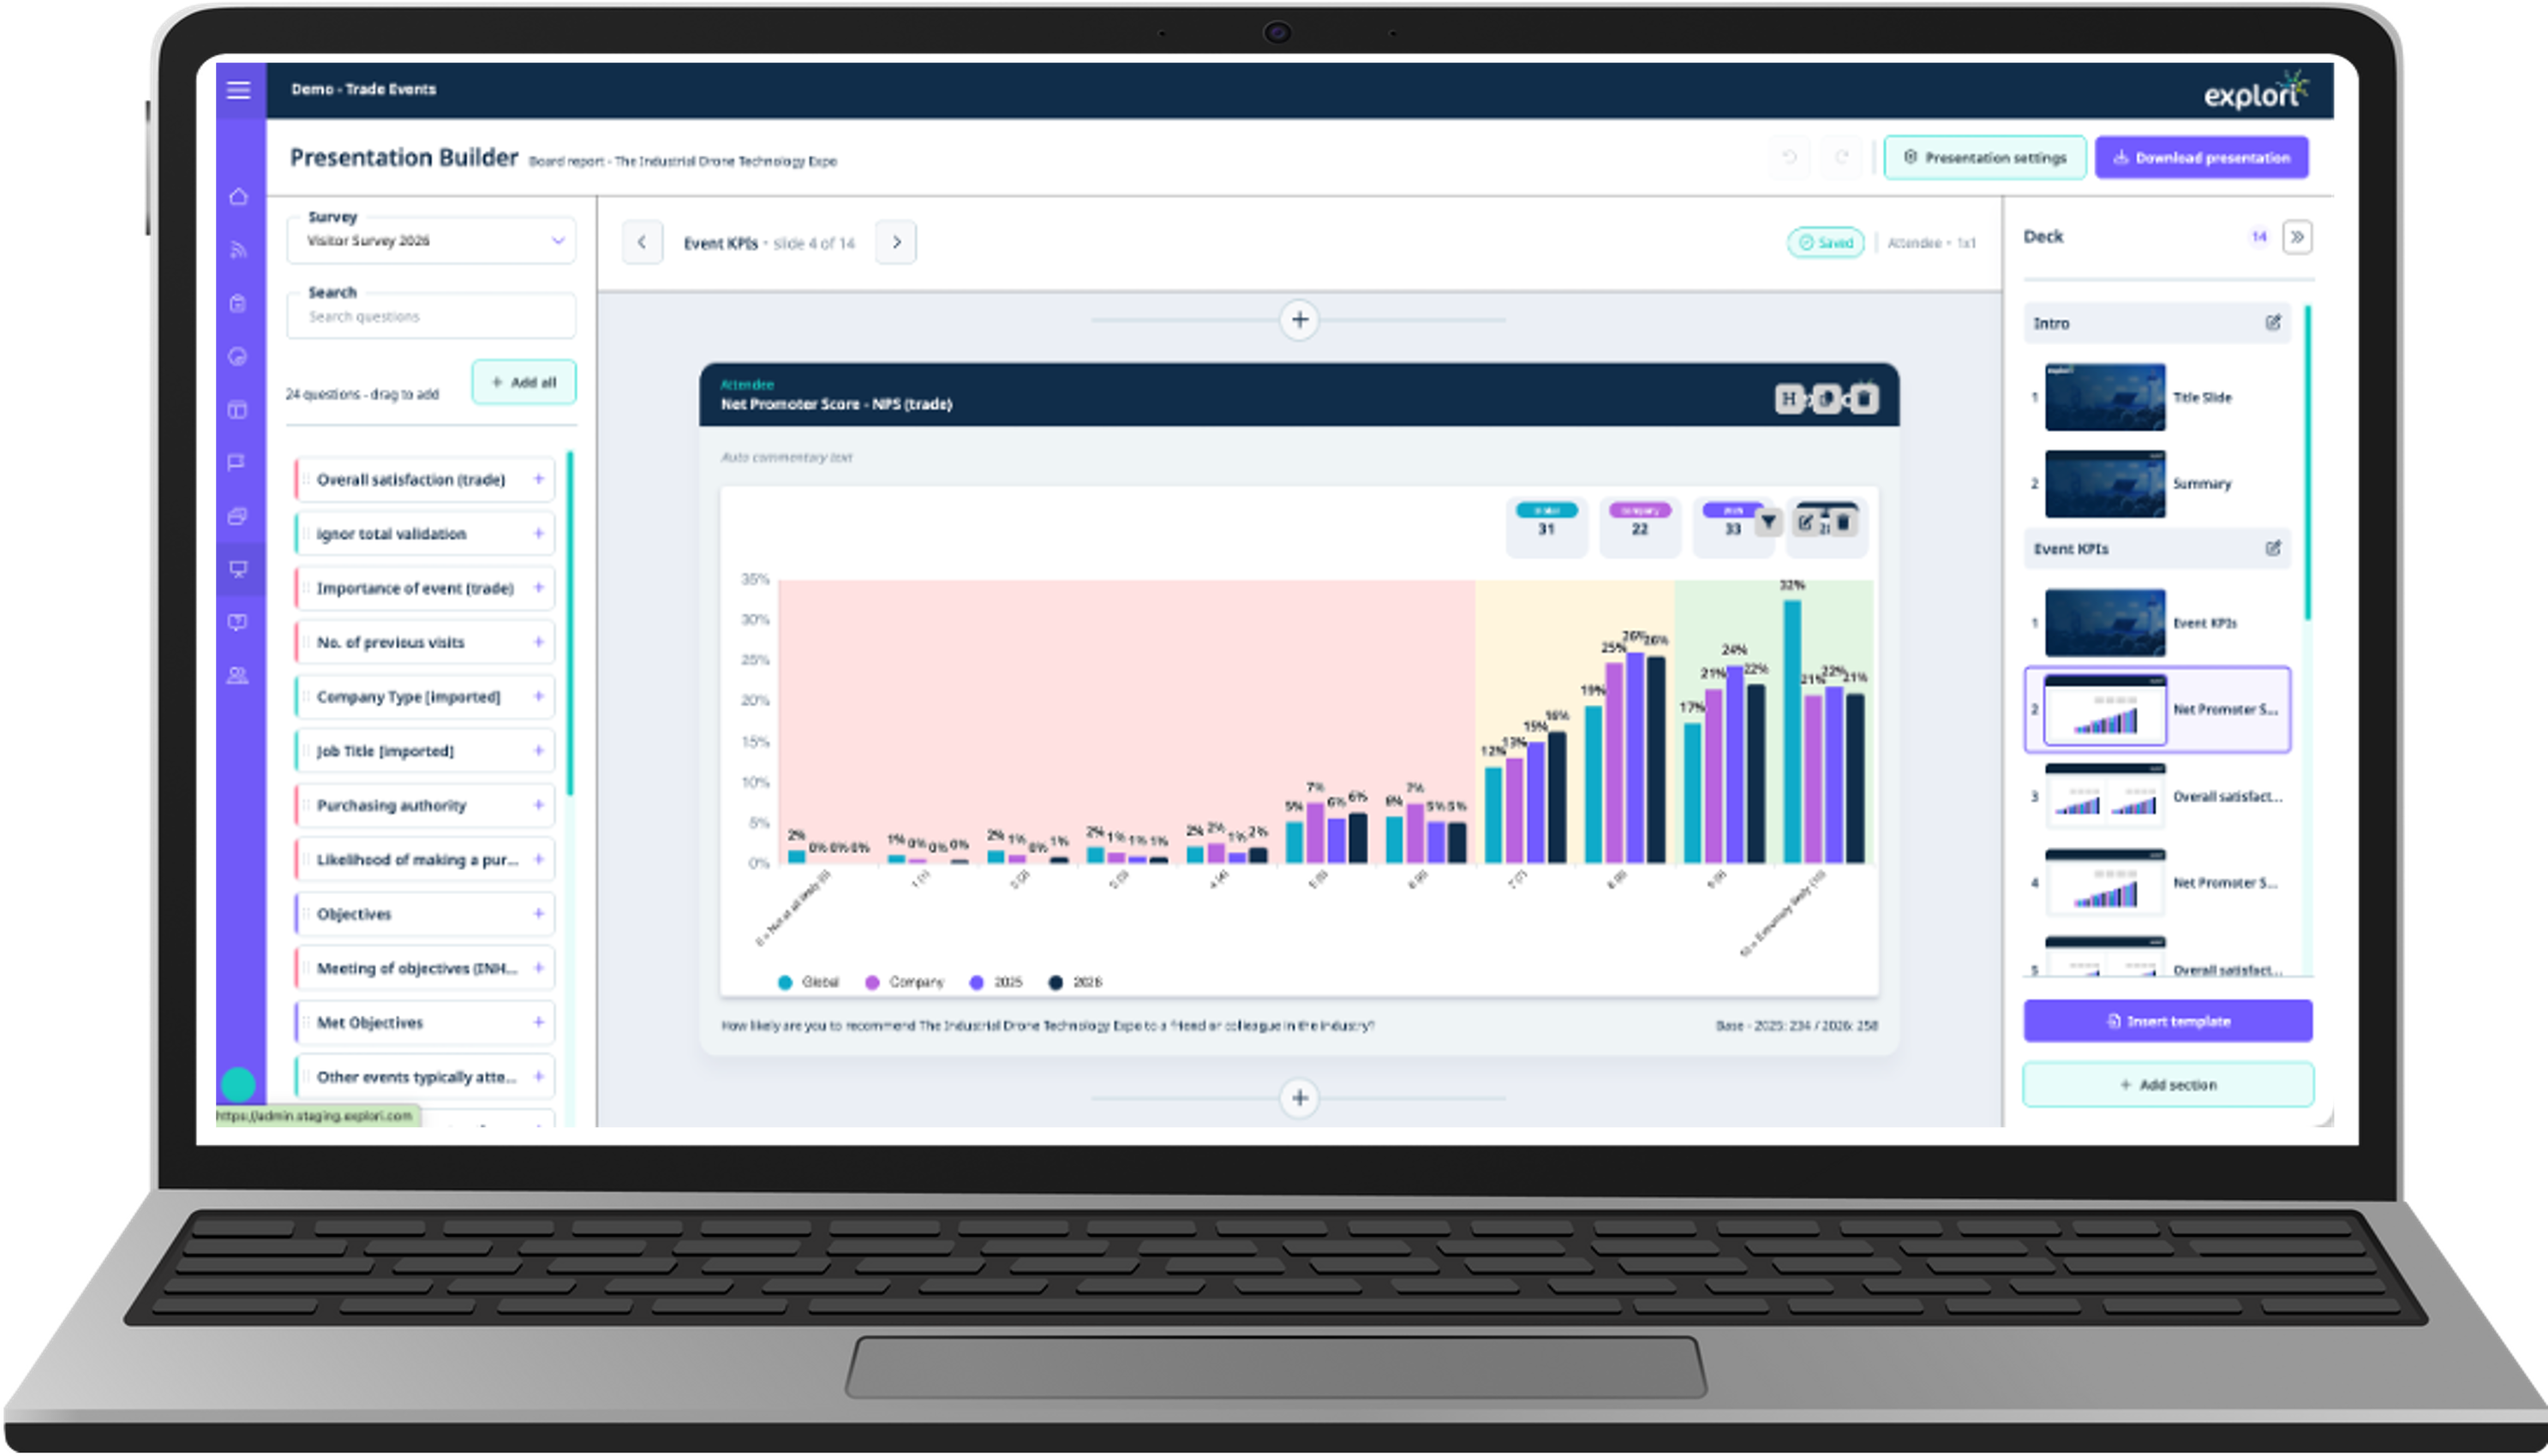
Drag in the questions that are most important, or add every question. Charts, layouts and benchmarks are generated for you.

  • Drag in what matters, or add everything
  • Charts and layouts auto-generated
  • Benchmarks included automatically
SlidePal question library with one-click add
AI Commentary

Commentary already written

A written summary on every data slide, drawing on available benchmarks and comparisons, so the deck reads as finished work with built-in context.

  • Summary on every data slide
  • Draws on available benchmarks and comparisons
  • Reads as finished work

“Entering new markets was by far the most widely held objective, followed by raising product awareness and building new relationships. Satisfaction was high across most objectives, but the two most commercially focused, writing orders and generating new sales leads, scored lowest, with lead generation both the least common objective and the least well met.”

Written by SlidePal. Not edited.

SlidePal slide with auto-written commentary
Combined Surveys

Both audiences, one deck

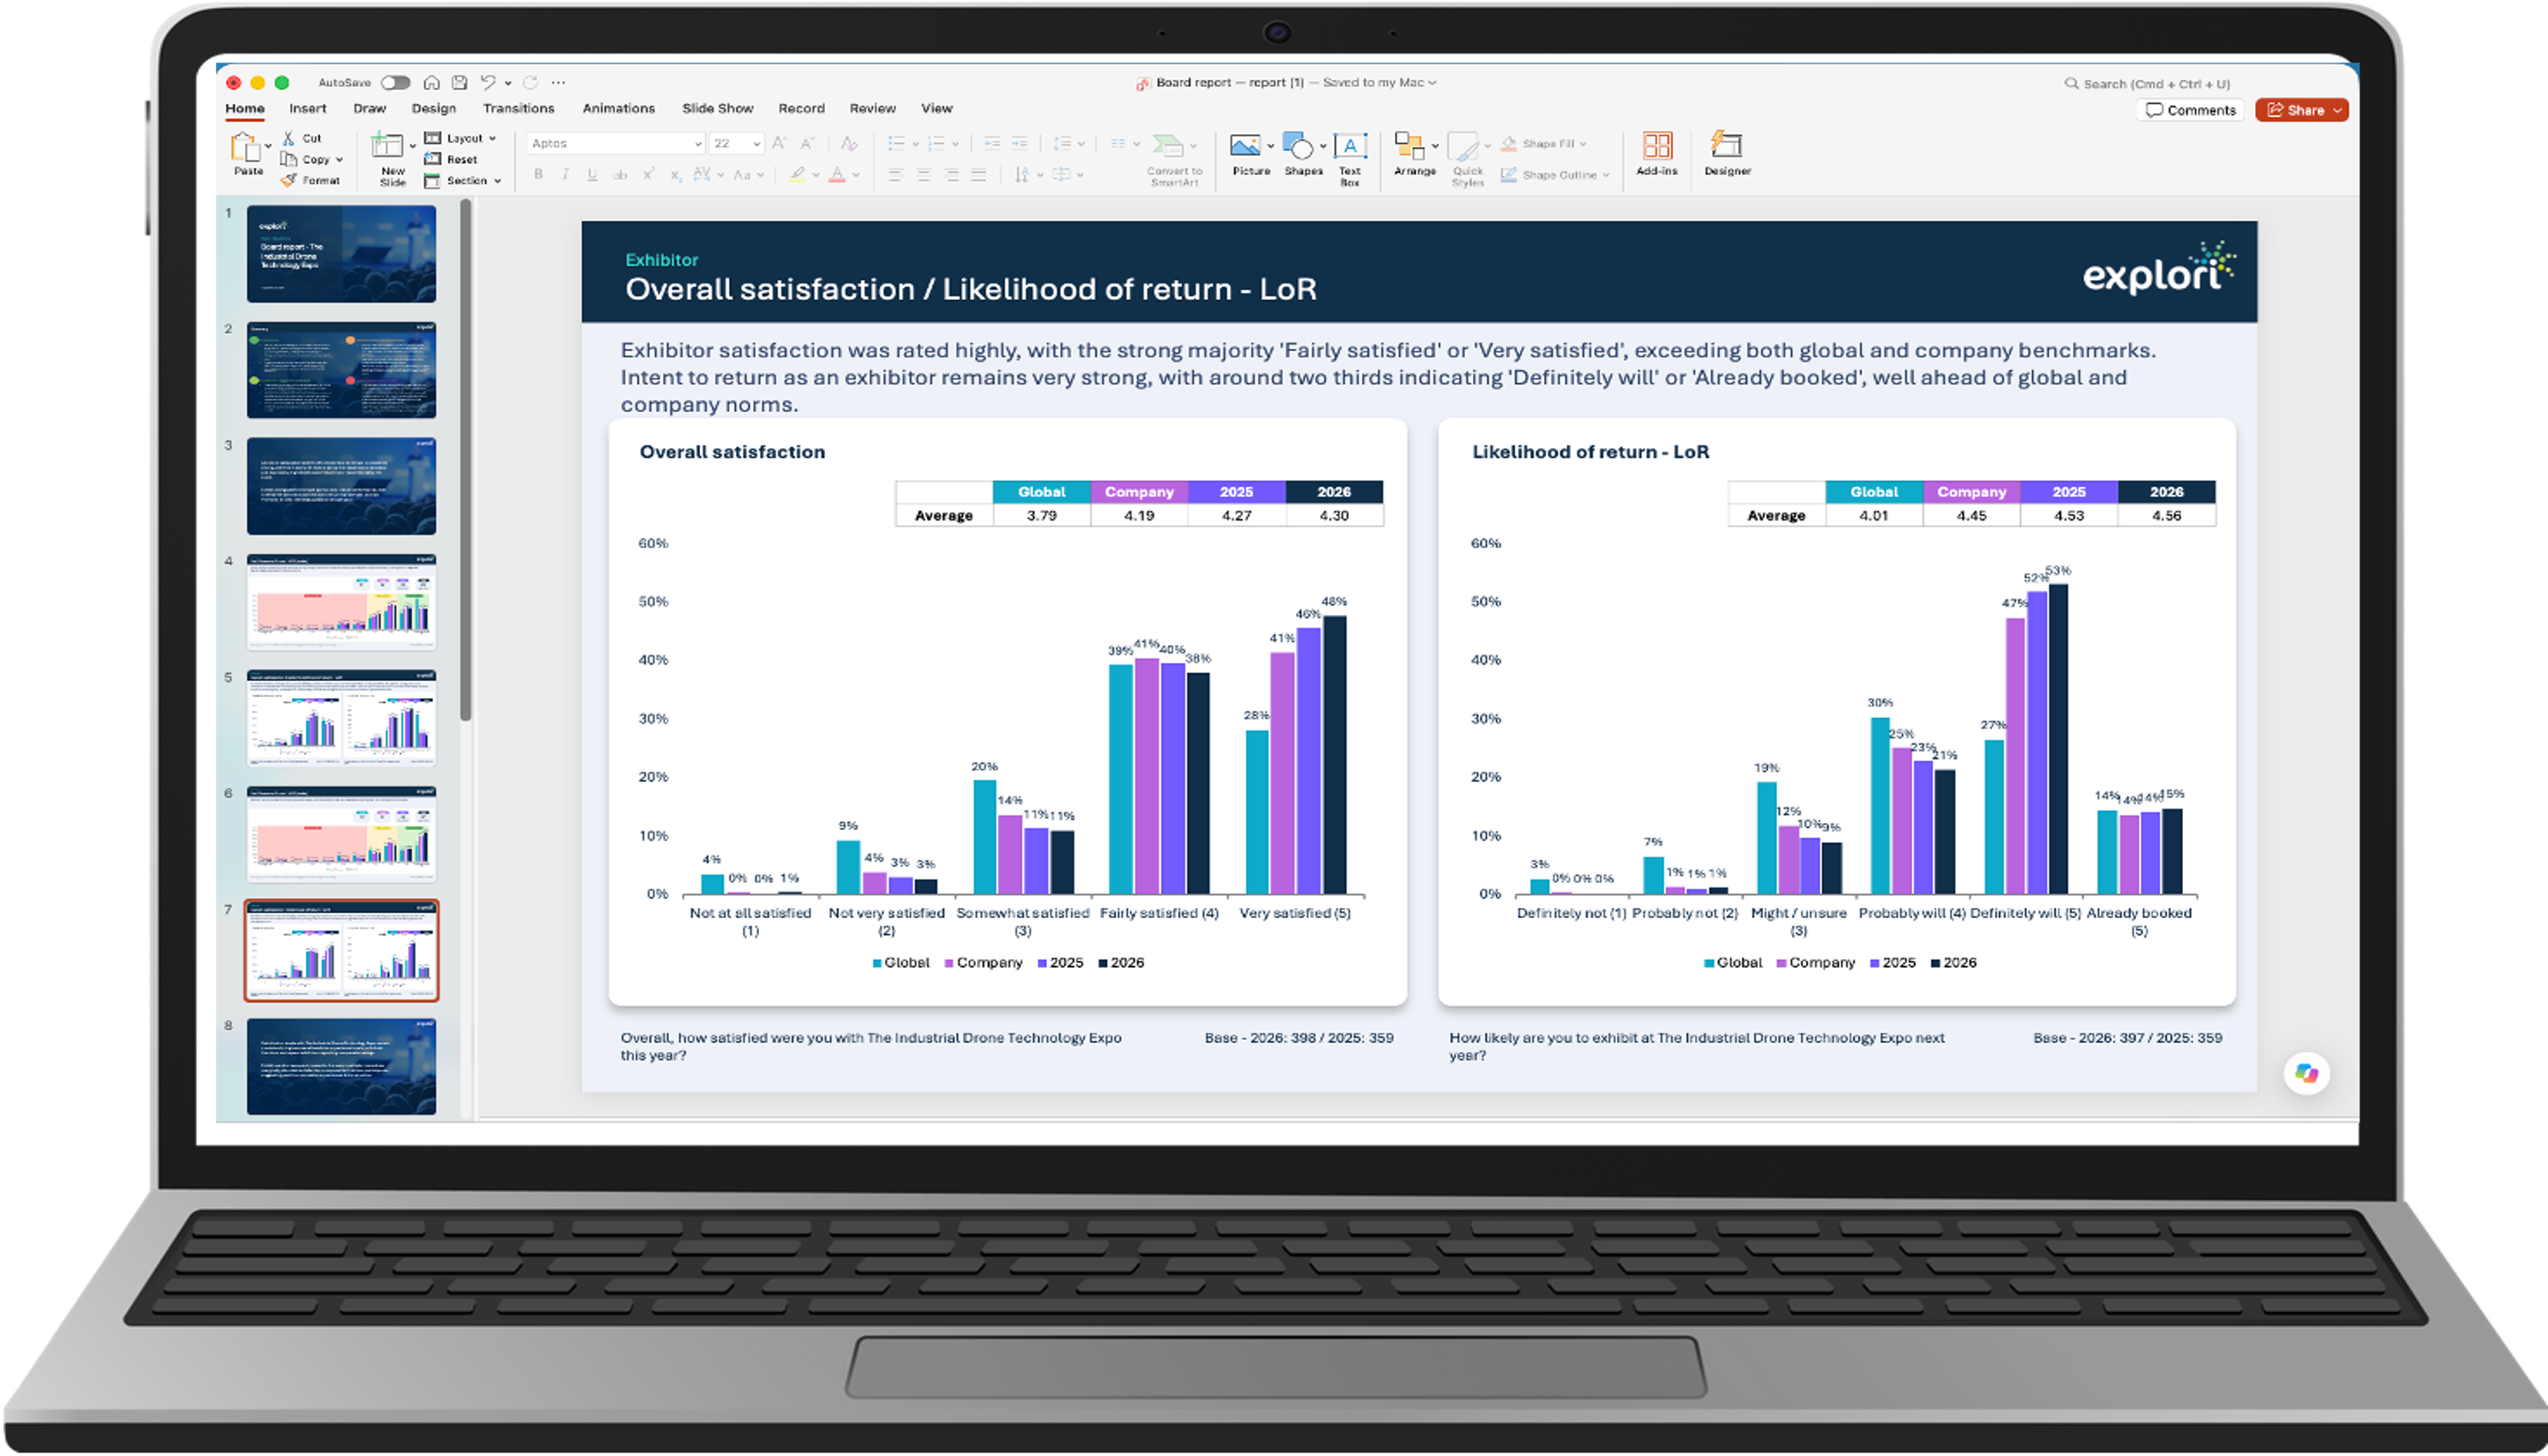
Visitor and exhibitor surveys combined into a single narrative across the event, in one deck.

  • Visitor and exhibitor surveys combined
  • Single narrative across the event
  • One deck, not two
SlidePal deck view combining survey results
REPORT STRUCTURE

It reads like a report, not a chart pack

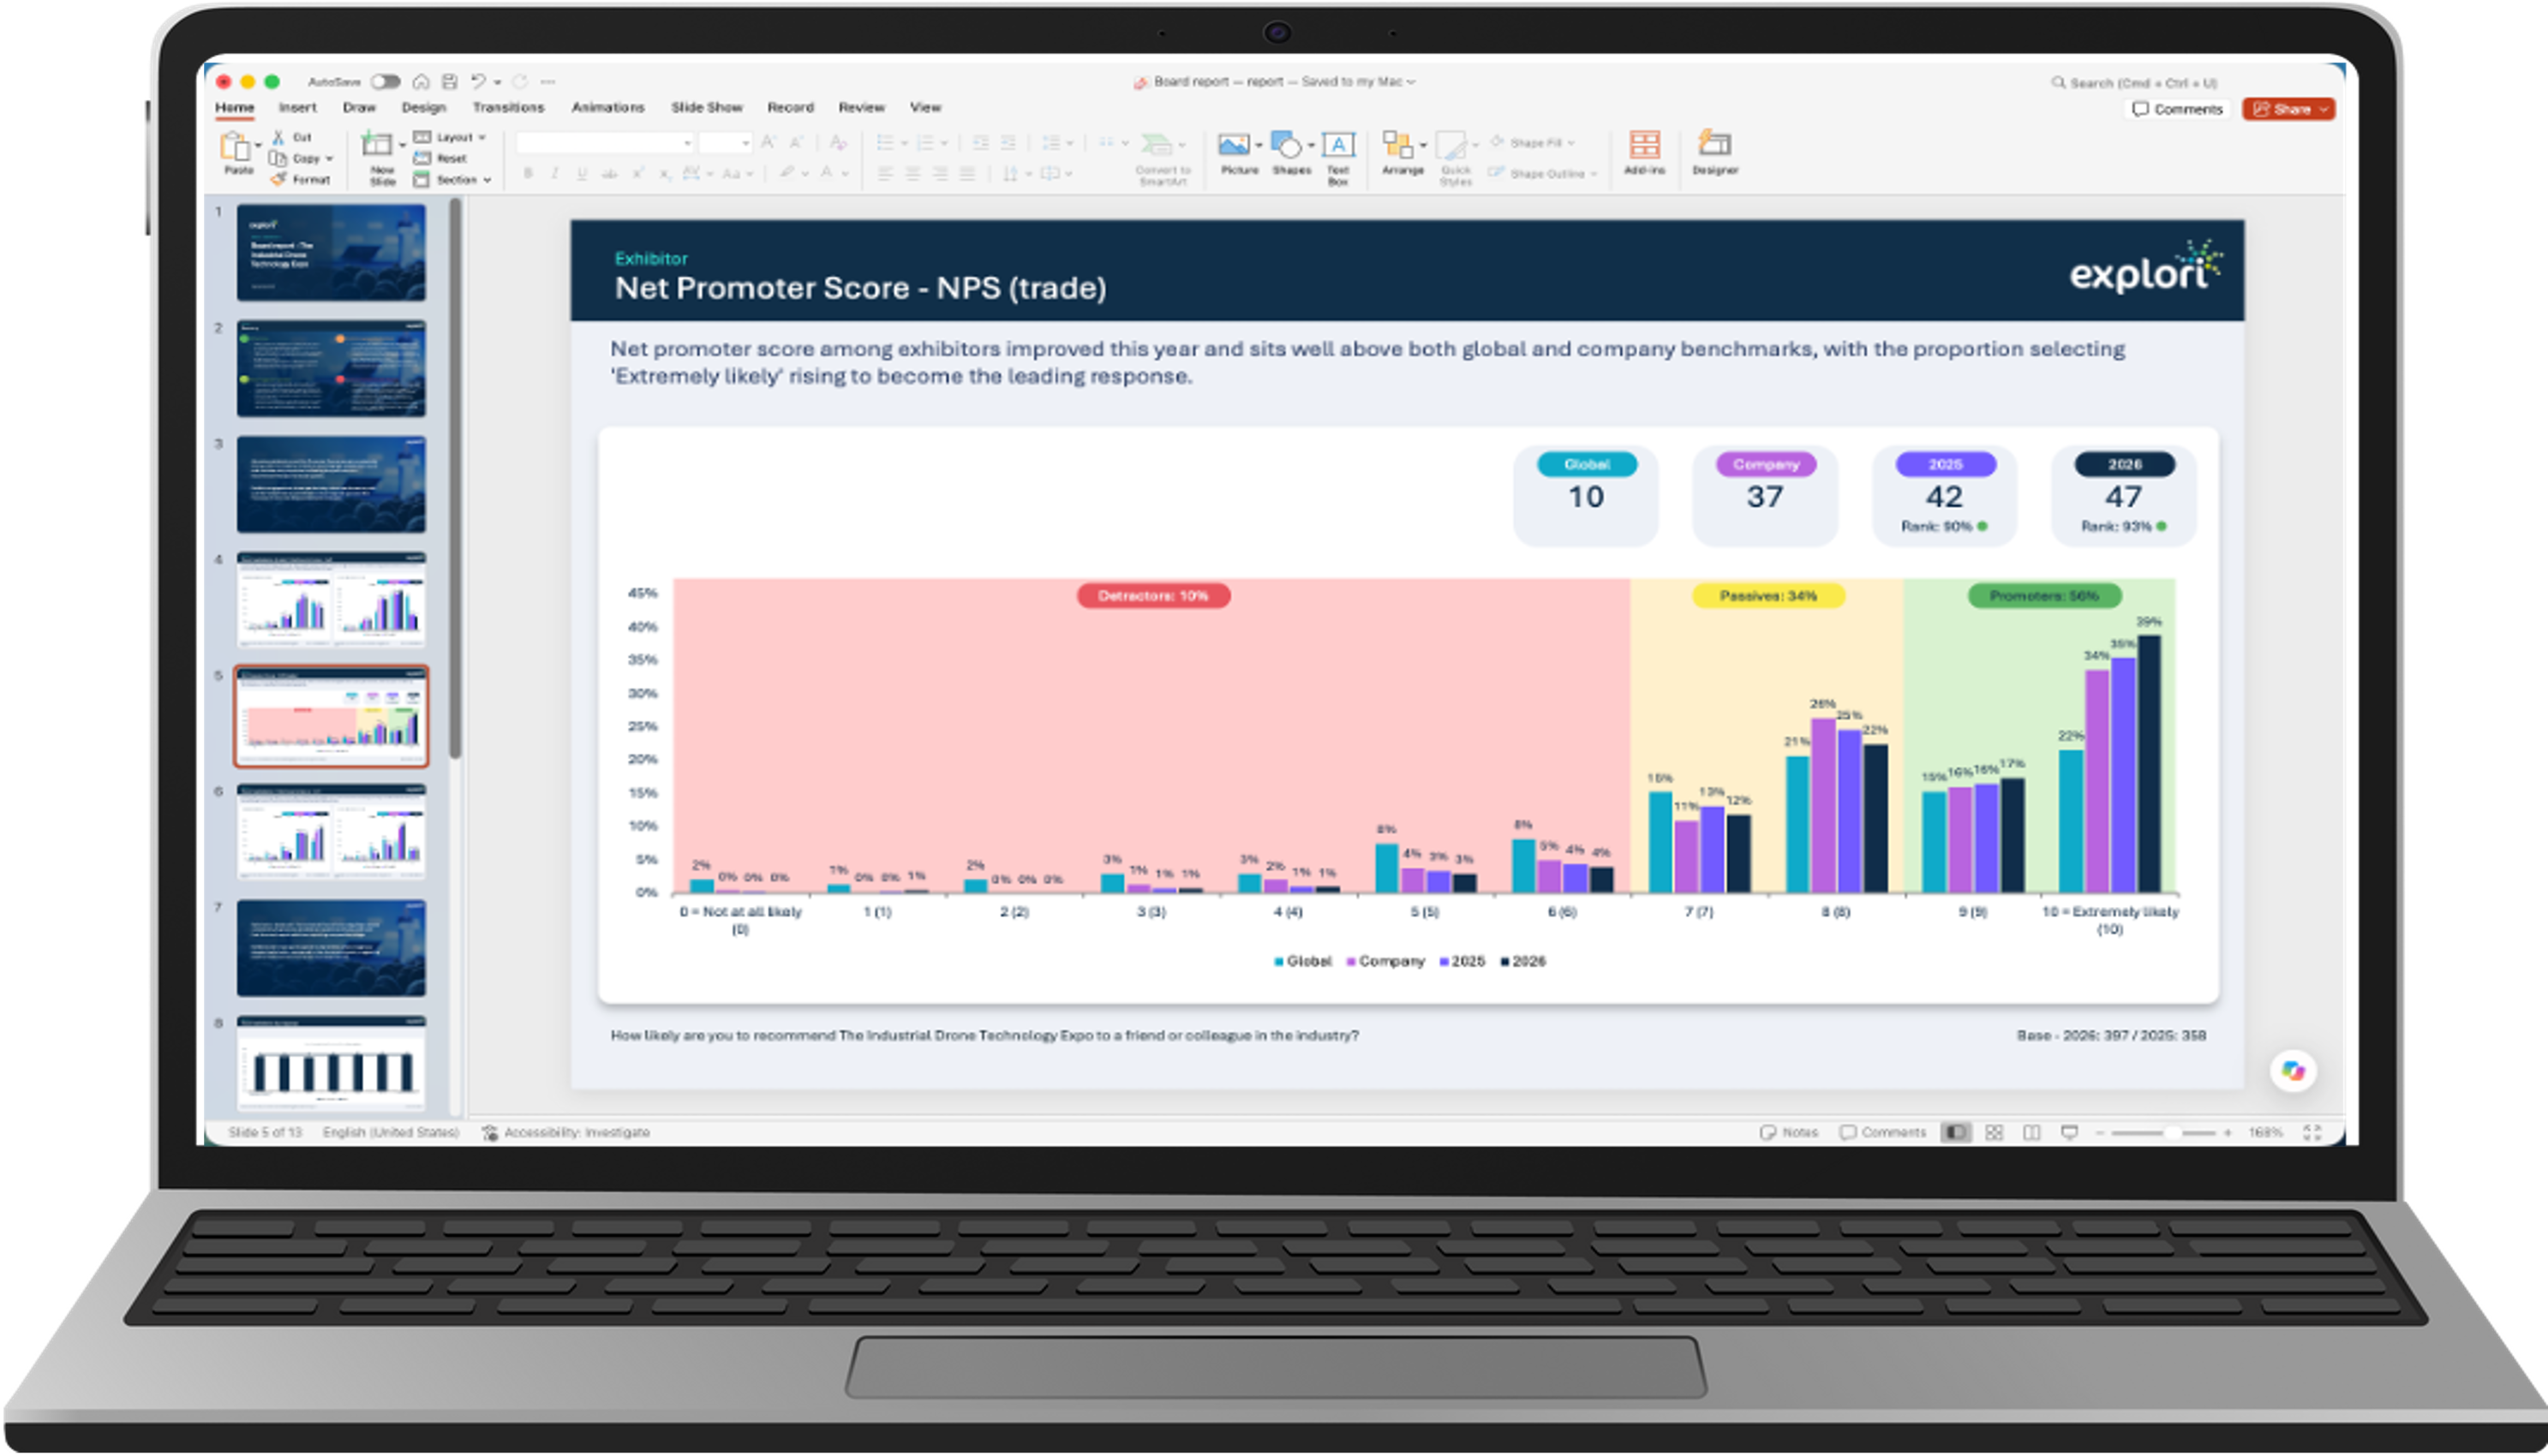
An executive summary up front, narrative sections that bridge the detail, and key results benchmarked against global, company, division and portfolio norms, with percentile rankings. The kind of deck someone would put in front of a board.

  • Executive summary generated for you
  • Section narratives between the detail
  • Percentile rankings against each benchmark
SlidePal deck with executive summary and benchmarked sections
OPEN-TEXT ANALYSIS

Open text, themed

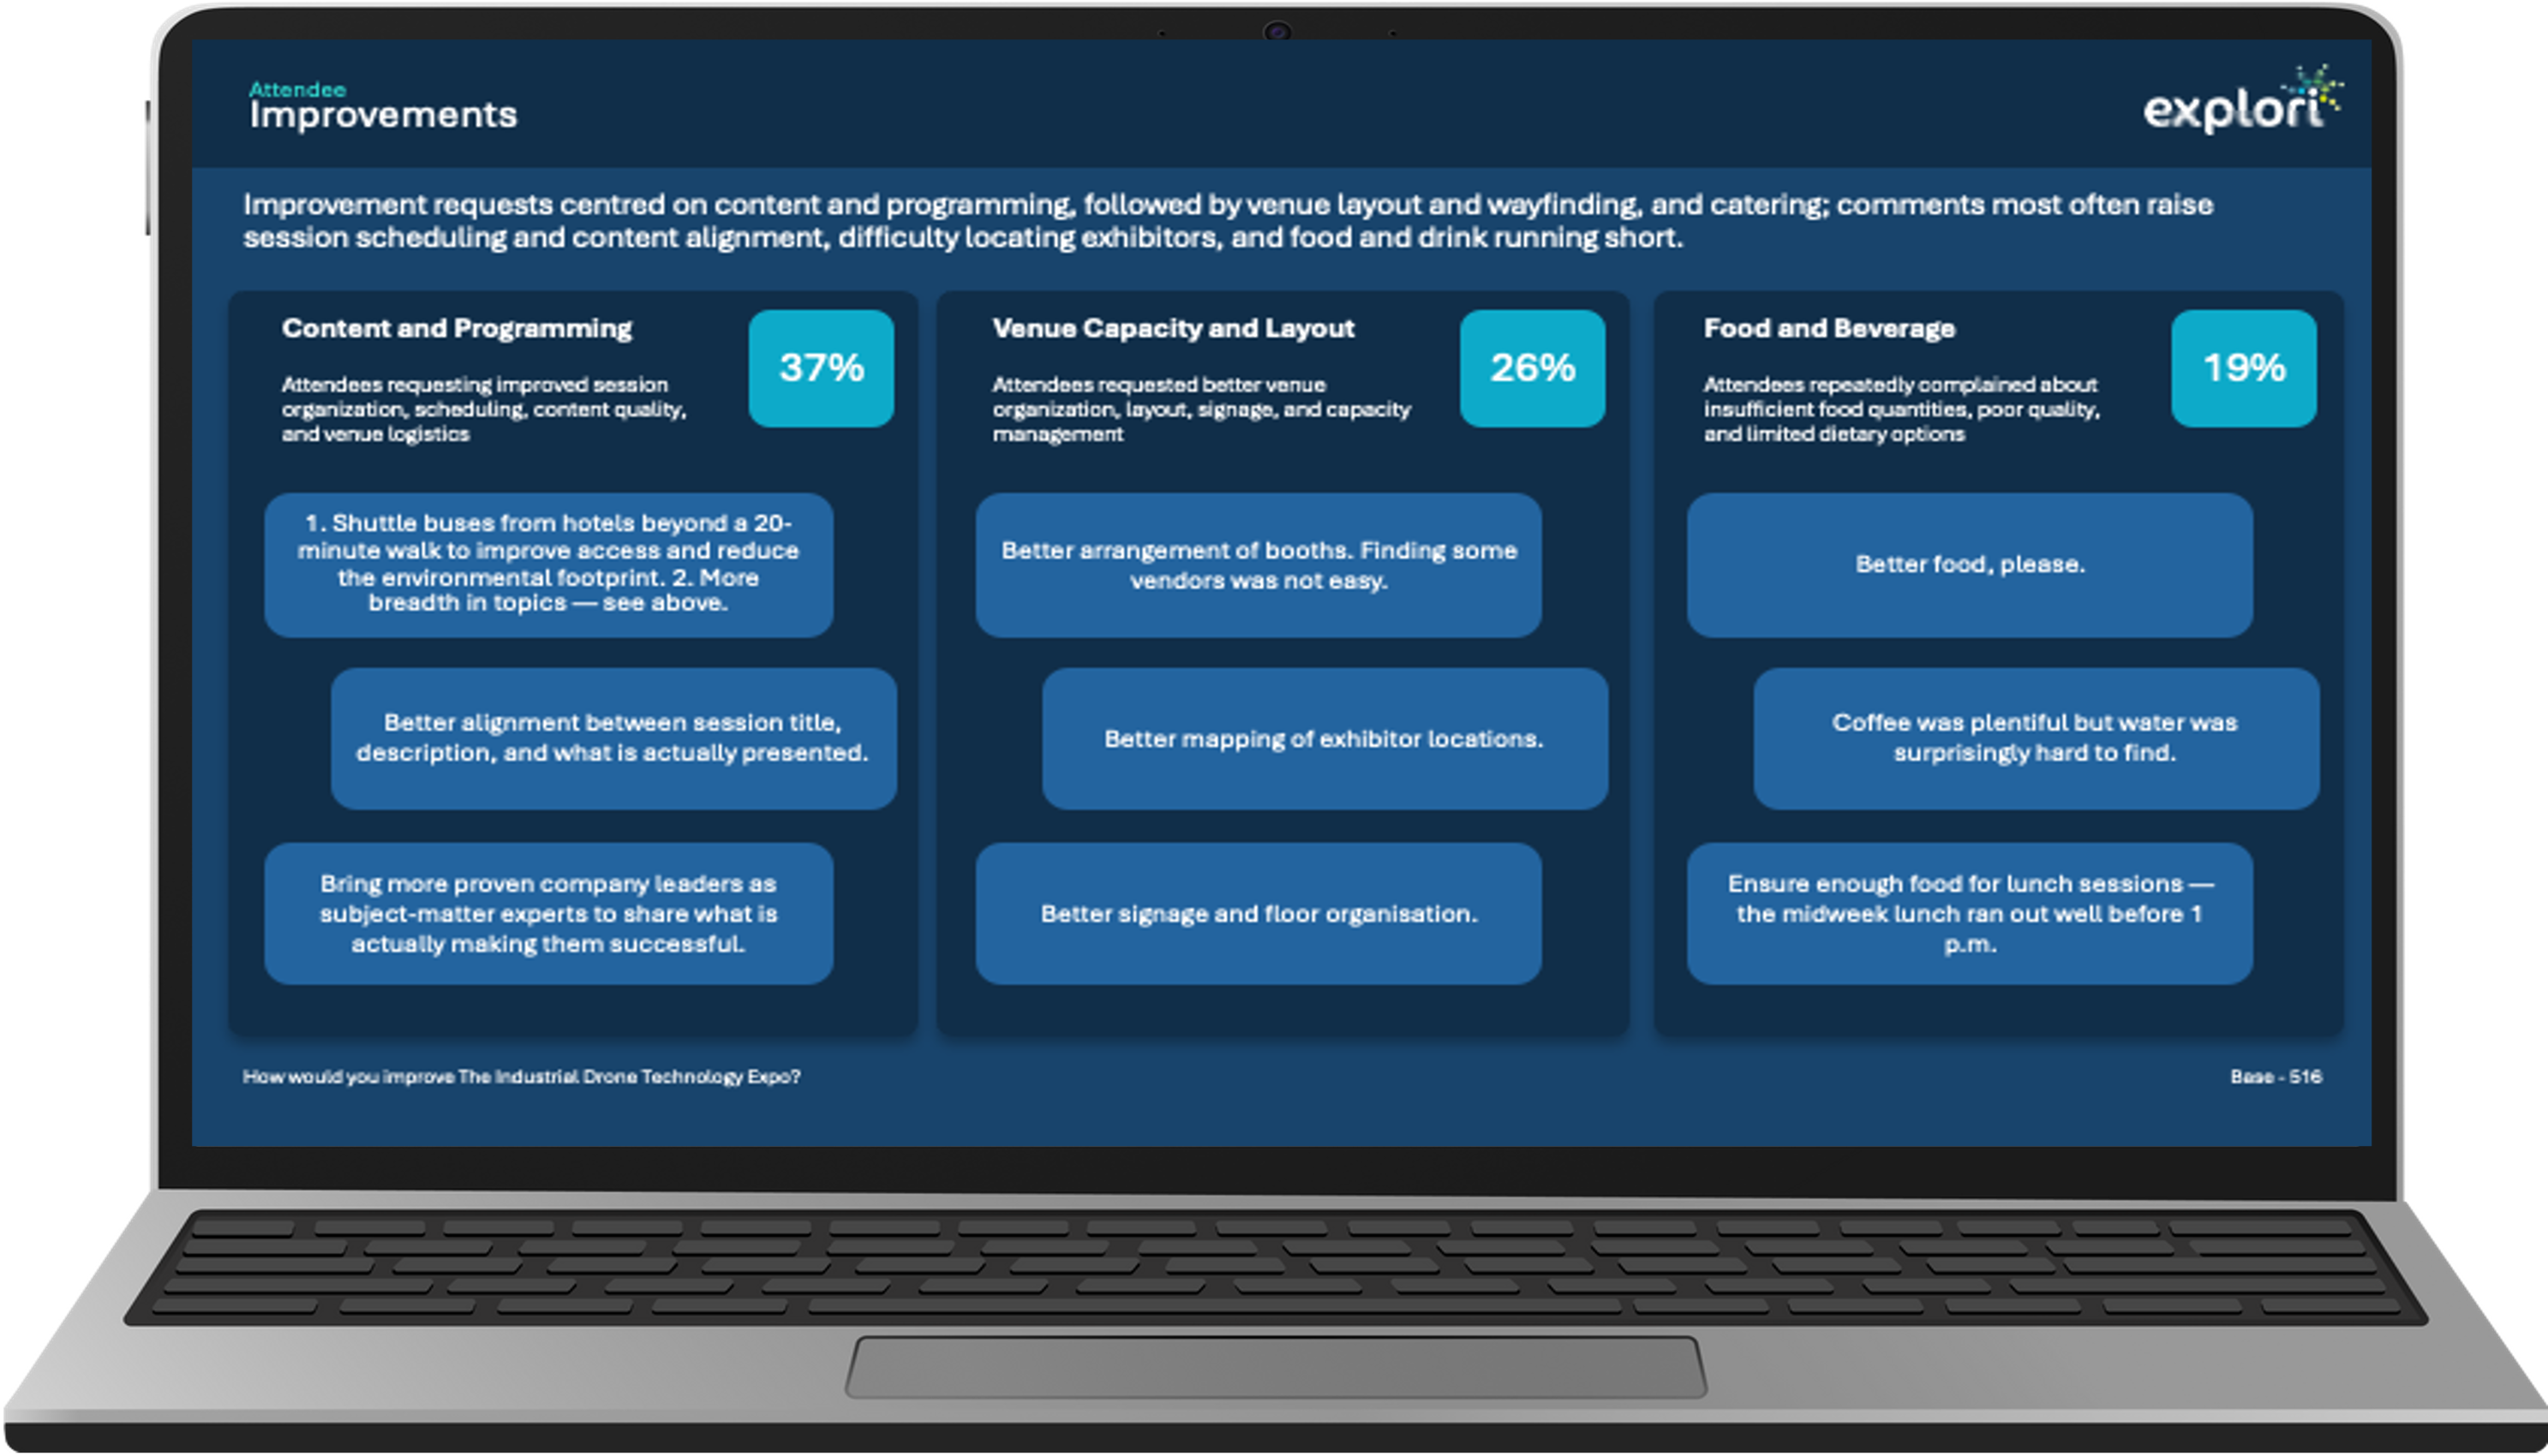
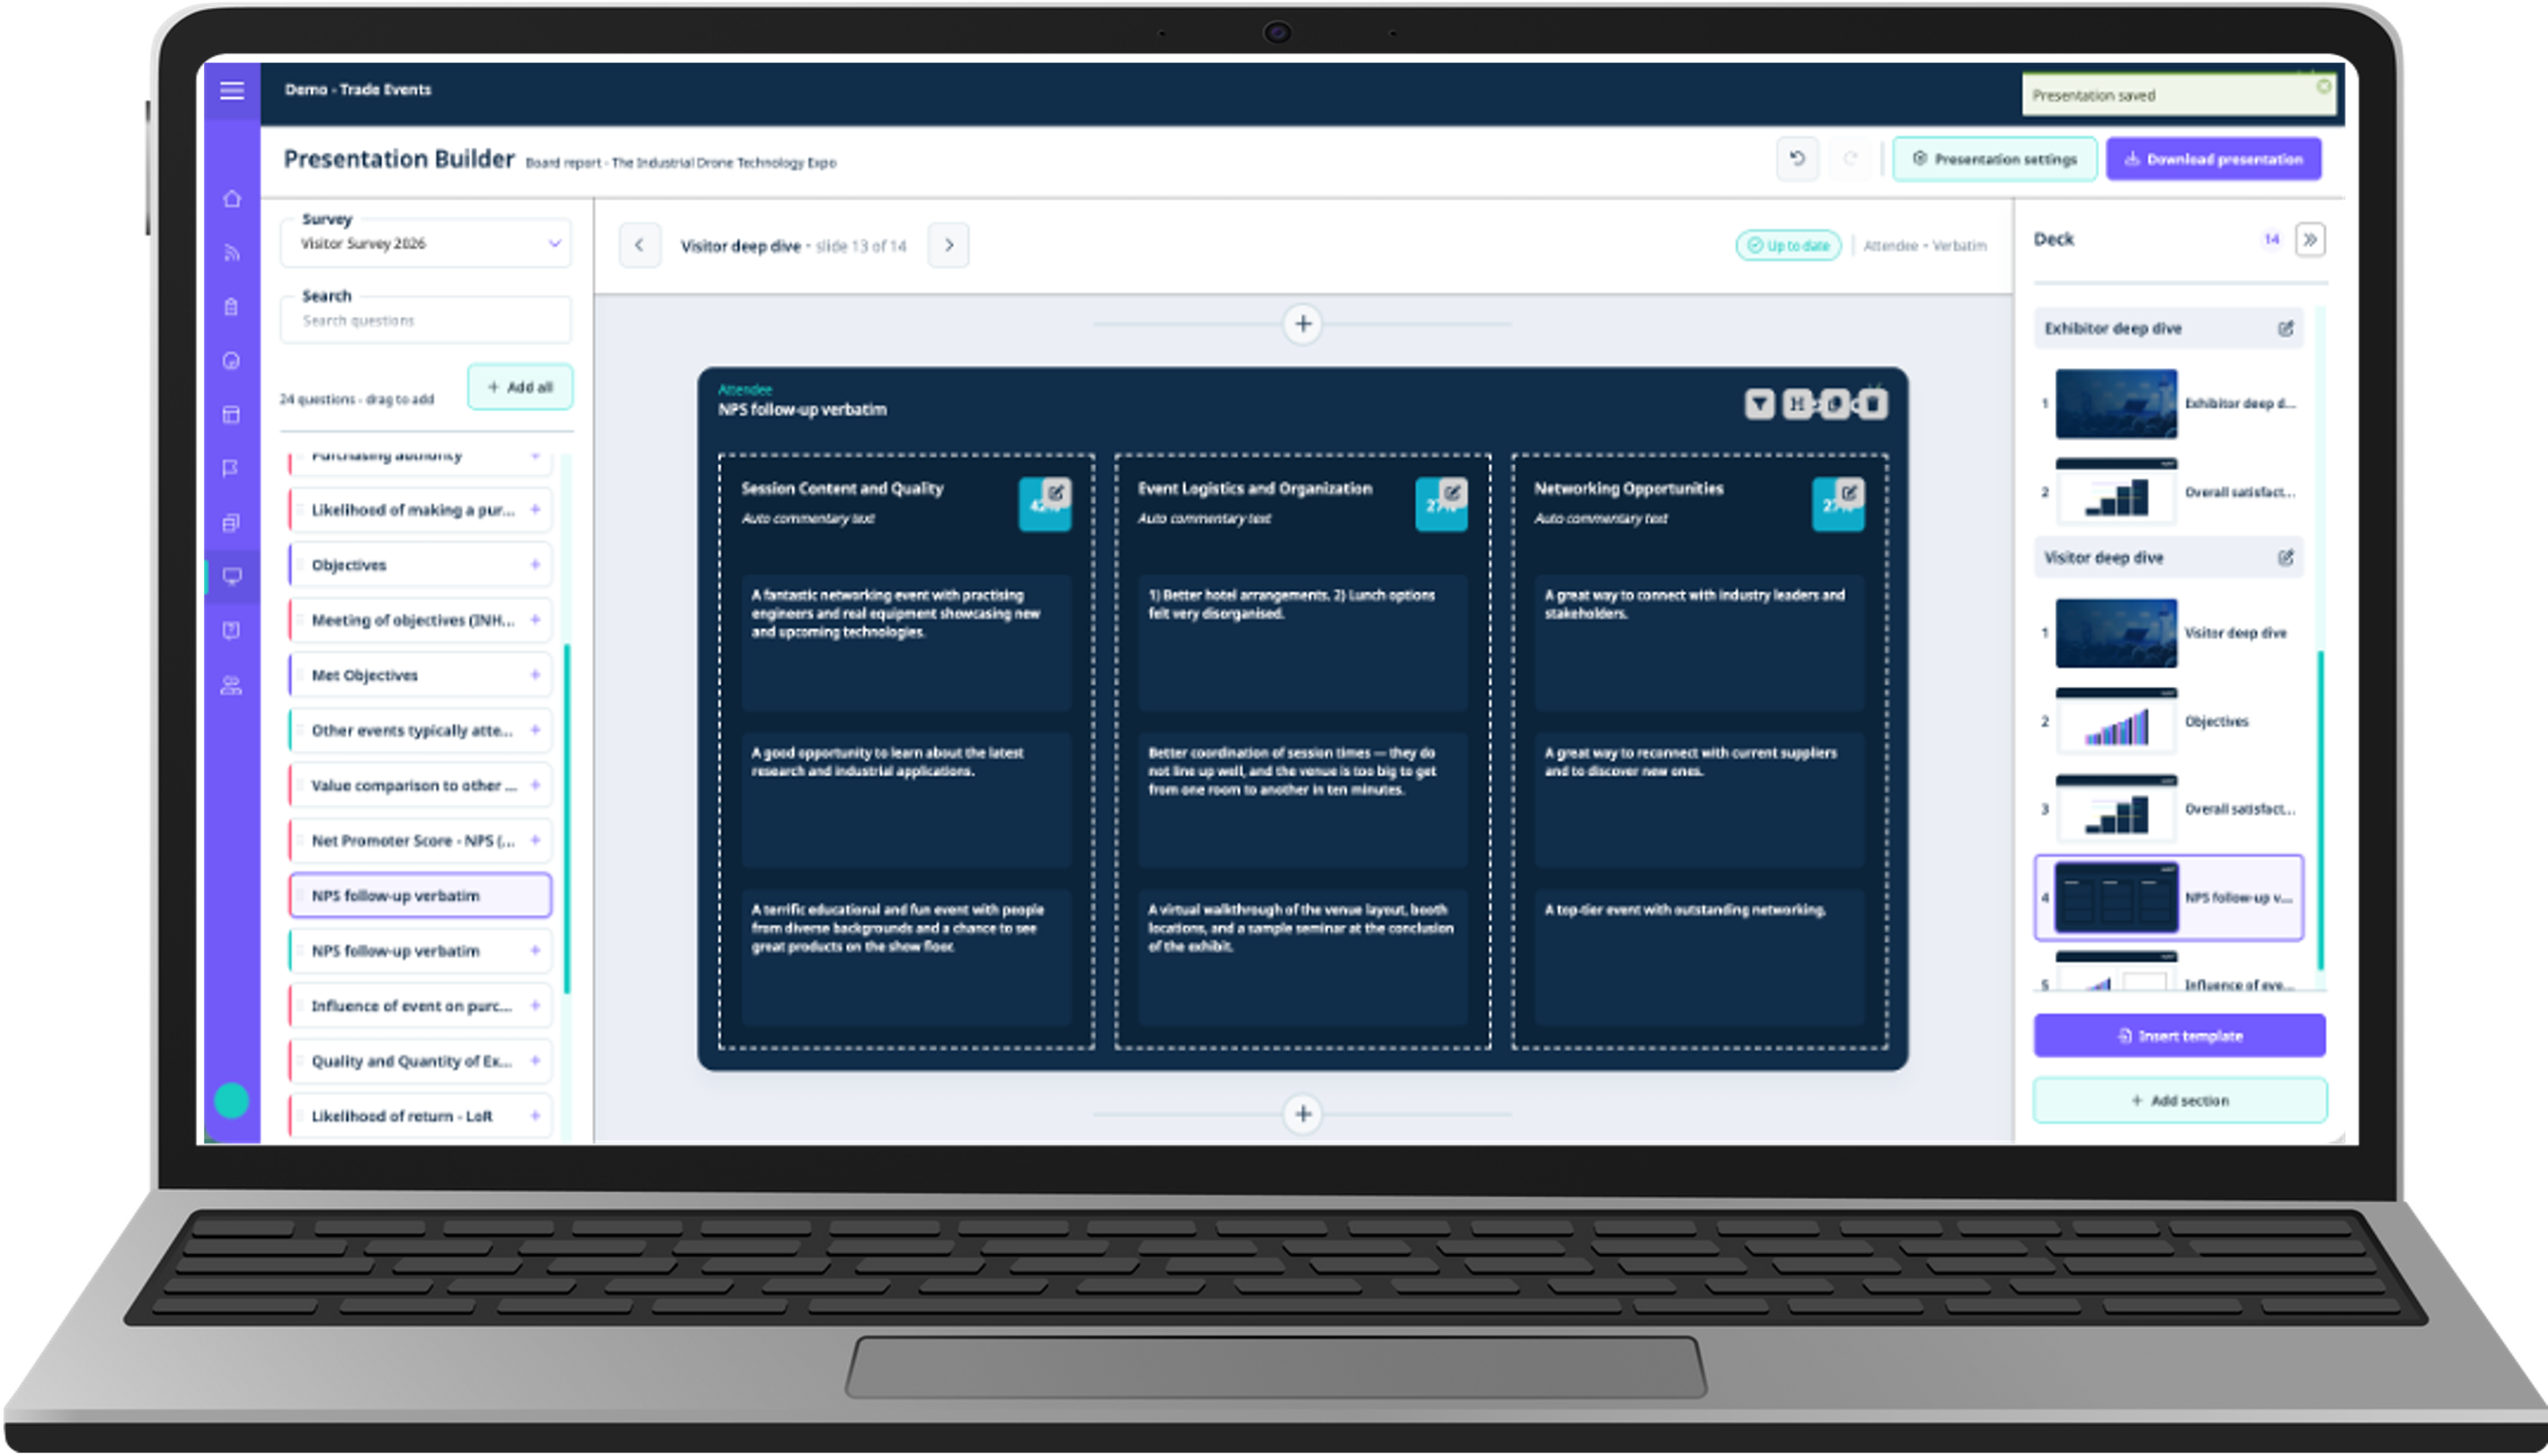
Open-text responses themed in one click, once a question has enough responses. No exporting your data into another tool.

  • Open-text responses coded by theme
  • Most representative comments shown for each theme
  • No spreadsheet, no manual sorting
SlidePal interface with question library and charts
Save as you go, pick it up later, and start next year's deck from this year's.
SlidePal or general AI?

SlidePal or a general AI tool?

General AI tools can build a deck from survey data with the right exports, prompts and checks. Here's how the two compare.

General AI tools
SlidePal
Getting started
Export, upload and write a detailed prompt
Select your event and surveys, then choose your charts and layout
Accuracy
Each figure needs checking
Charts built straight from your survey data
Benchmarks
No comparable benchmarks to measure against
Compared against comparable benchmarks in Explori's data
Research details
Base sizes and year on year need specific prompting
Included automatically
Making changes
Re-prompt, re-download and re-check
Edit directly in the builder
Consistency
The structure can change each run
The same structure each event
Who it's for

Made for teams who present and act on results, not just collect them

Research and insight teams

Consistent, benchmarked decks across every event, with time moved from building charts to interpreting the results.

Marketing and event leads

A board-ready deck without a research team behind you.

Insight and operations leaders

Reporting effort removed across a portfolio, not an hour saved per deck.

Demo

See it in action

Prefer to drive? Click through the product yourself.

Part of the Explori platform

Powered by the data you already collect

Every chart, benchmark and open-text response comes from the surveys you're already running in Explori. No exports, no rebuilding the story somewhere else. SlidePal turns your event data into the deck your leadership team sees.

Explore the platform →
FAQs

Common questions

Click any question to expand the answer.

Stop building decks. Start presenting them.

Already a customer? Ask your account manager.

Want the research, analysis and story handled for you? That's Managed Services.