
The intelligence layer events have never had.
Five measurement dimensions. One decision-grade view. Executive-ready intelligence that makes event investment as governable as any other major spend.
The latest platform innovations, from our founder
Founder Mark Brewster walks through the AI analysis agent, benchmarking, dashboards and one-click PowerPoint reporting.

Take a self-guided tour
Walk through the platform at your own pace.
What Explori actually measures
One framework, measured the same way every time. Comparable across events, time, and the wider industry.
Experience and Advocacy
What attendees thought, and whether they'd come back.
Brand and Perception
The perception change attributable to attending: measured, not assumed.
Attitudinal and Cognitive Shift
The shift in thinking the event was meant to create.
Behavioural and Commercial Impact
What attendees actually do differently. The signals before pipeline and renewal.
Portfolio and Comparative Performance
How this event compares across time, portfolio, sector, and industry.
Five dimensions. One decision-grade view.

"The team feels like they finally have the tools and the backup they need to tell the story."
From instinct-led planning to decision-grade event intelligence.
Three capabilities that change the conversation
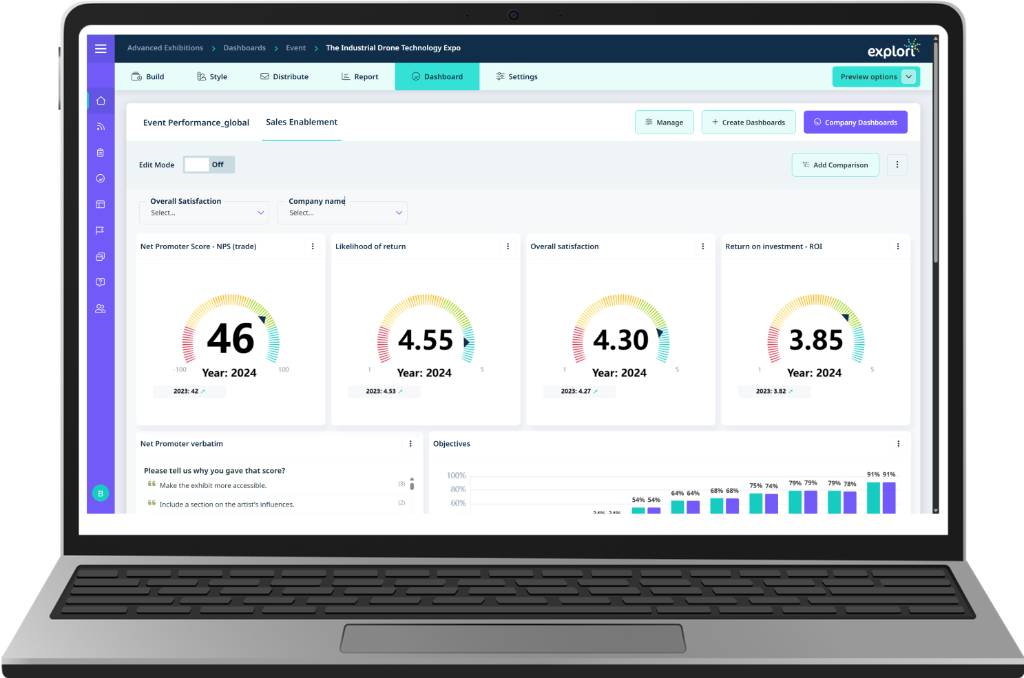
Decision-grade intelligence, not just a dashboard. Here is what visitors, exhibitors, and boards actually see.
Insight at the speed of decisions
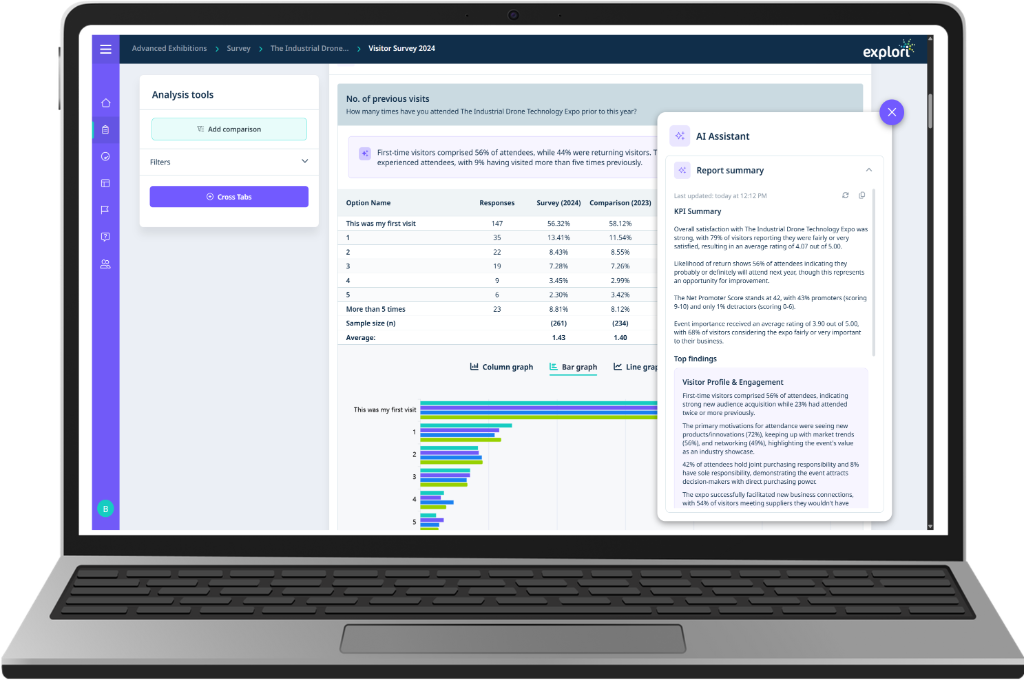
AI survey summaries
A narrative read of the whole survey's performance: KPI summary, top findings, and recommended actions, read in the context of your benchmarks. Ready for the room, not buried in a spreadsheet.
AI open text analysis
Turns the open-text responses to a question into the themes within them, each with a positive, negative, or neutral sentiment read, and filterable by theme.
Every number, read in context
Explori's benchmark database is built from 10,000+ events measured since 2012, with a live benchmark set of over 3,000 events. Every client result is contextualised against what excellent actually looks like, across their portfolio, their sector, and the global benchmark.
- 10,000+ events measured since 2012
- Live benchmark set: 3,000+ events
- Sector, portfolio, and global comparison
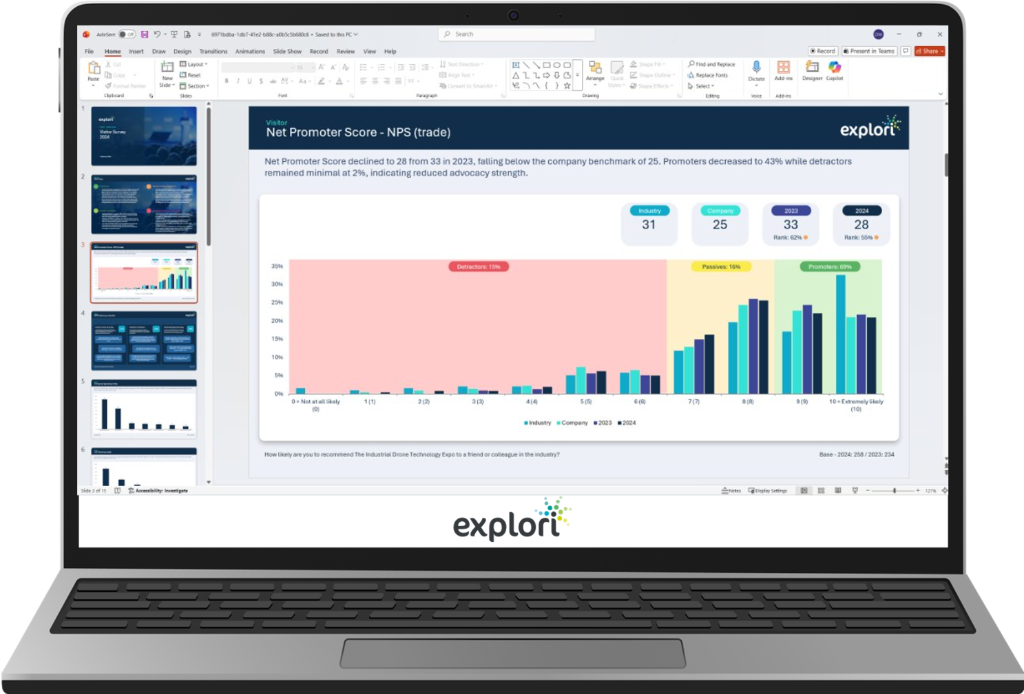
Executive-ready in one click
Branded, presentation-grade PowerPoint reports generated on demand. The slide your CFO would build, without the days it takes to build it. Automated workflows replace weeks of manual post-event effort, so reports reach decision-makers before the next planning cycle begins.
- One-click PowerPoint generation
- Fully branded, presentation-grade
- Reports land in days, not weeks

"I don't like a supplier relationship. It's about a partnership, and I think that's what we do really well with you guys."

From post-event reporting to a continuous data foundation for planning.
What you get with Explori
Built for event professionals and marketers, loved by internal research leads. The four advantages built into Executive Event Intelligence, and the benefit each one delivers for your team.
Capture more, capture deeper
- Multi-channel survey distribution
- Registration data ingested to deepen the analysis, so responses connect to who attendees actually are
Higher response rates and analysis with real depth, with segment-level insight rather than surface scores.
Analysis that produces intelligence
- AI-powered analysis
- Composite metrics including the Explori Event Score, plus composite metrics tailored to your requirements
- The world's leading event measurement benchmarks, built on a unique, secure industry benchmarking infrastructure
Every result read in context, with the drivers of loyalty, satisfaction, price tolerance and advocacy made visible, so the intelligence feeds event strategy rather than sitting in a report.
Intelligence for every layer of the organisation
- Reporting built for each level: event leadership, portfolio leadership, and executive leadership
- Advanced automated PowerPoint reporting
The right intelligence at the right altitude, with hours of analysis and deck-building time given back to the team.
Expertise behind the platform
- Customer intelligence programmes tailored by experts to your organisational needs
- Managed services for teams who want the programme run end to end, see research services
- Trusted by event organisers globally
Strategic intelligence at the core of building and protecting a must-attend event, with expert support scaled to how much you want to do yourself.
Common questions
Click any question to expand the answer.
Ready to see what decision-grade intelligence looks like?
Talk to the team. We will show you what measurement looks like for your event programme.