
Why event open-text responses have always been a black hole, and what's changed
Pretty much every post-event survey produces them. Hundreds, sometimes thousands, of verbatim responses to questions like "What could we have done better?" or "What was the most valuable part of your experience?"
We often say at Explori that open-text feedback gives you the colour that your quantitative data outlines.
For most event teams, this rich data exists, but open-text responses have represented the same operational problem for years: too much volume to read manually and too qualitative to include in the executive summary without someone spending hours doing it by hand into a consistent taxonomy.
Often, the result is that open-text data gets collected, glanced at, but largely ignored and fails to enrich the feedback narrative truthfuly.
That is not a data problem. It is an analysis infrastructure problem. And it is one that AI is perfectly suited to dealing with.
What the old model looked like
Until recently, organisations tried to solve this with two mechanics.
The first was manual coding: a human reads through responses and assigns each to a best fitting categorisation. Time-consuming, inconsistent at scale, and heavily dependent on whoever is doing the coding that week and their research skillset.
The second was fixed thematic frameworks: a set of predetermined categories, adopted to create consistency and scale, and applied across all responses regardless of what respondents actually said. This often produces counts. It does not produce insight. If your respondents spent 40% of their verbatim responses talking about something your fixed framework did not anticipate, that signal disappears entirely.
Both approaches shared the same failiure point: the analysis was not shaped by what respondents actually said.
To be clear, this was not just a failiure of event teams, this was a widespread limitation of open-text analysis. And even experienced researchers (like myself) wrestled with this for years.
What AI thematic and sentiment analysis does differently
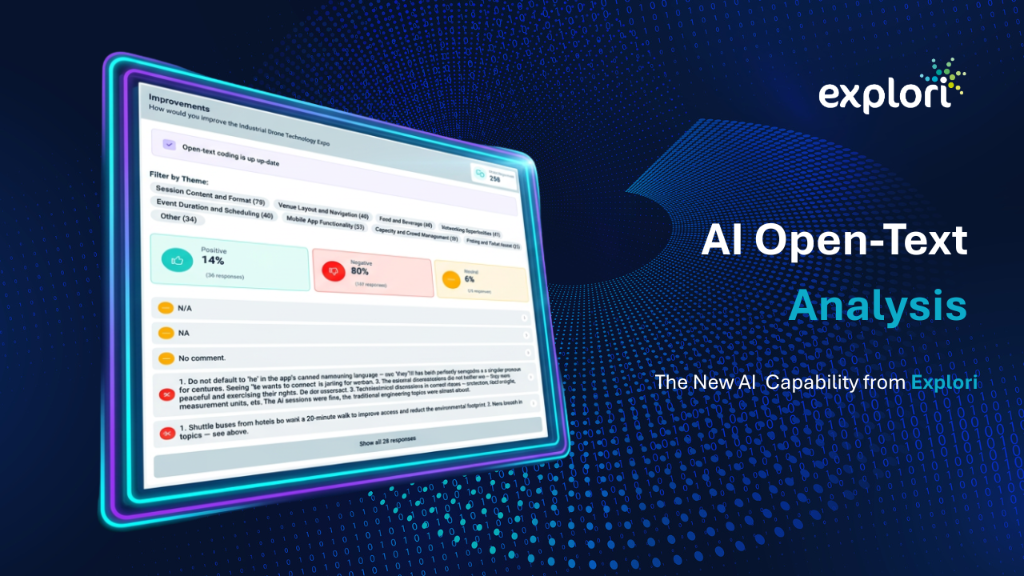
Explori's AI open-text analysis generates themes dynamically from the actual content of each event's responses, rather than applying a fixed category list.
That distinction matters more than it might sound. A technology conference, hobbyist show, trade exhibition and internal event will surface completely different themes, and that difference is still present between events of a similar type, not because the questions are fundamentally different, but because the audiences, the format, and the commercial context are different. A fixed taxonomy forces all audiences and contexts into the same box. Dynamic theme generation reflects what each audience actually said.
The analysis also layers sentiment within each theme. It is not sufficient to know that "exhibitor onboarding" is a recurring topic. You need to know whether respondents are raising it as a frustration or a strength. Sentiment at the theme level (positive, negative, neutral) gives decision-makers directional intelligence to act on, not just a list of things people mentioned.
Analysis can be triggered manually during fieldwork for early signal, and regenerates automatically when the survey closes, so the final insights reflect the complete response set rather than a midpoint snapshot.
What this means for the decision being made
The point of asking open-text questions is to understand the rich and varied experiences and feelings of your audience. But only selecting a handful of comments to digest is like ripping random pages from a book and hoping you understand the story. However, reading every comment is time-consuming. Skipping most of them means missing the story.
The use case for AI open-text analysis is not "read your open-text responses faster." That undersells it. It's that you don't have to choose between tradeoffs, you don't need to read every comment but you can understand the full story.
When a stakeholder asks what exhibitors thought of the onboarding process for your flagship event. Previously, the honest answer was "I've seen some of the comments but I have not had time to get the full picture." Now the answer is a dynamic thematic and sentiment summary of every response on that topic, available inside the platform, filterable by theme, with the underlying comments accessible for any that need scrutiny.
That is the difference between qualitative data that decorates a report and qualitative data that supports a decision.
A note on the transition from fixed coding
Explori's legacy fixed thematic code frames are being phased out as part of this release. For clients who have used fixed coding historically, here is what to expect.
From launch, a four-week transition window during which legacy AI coding can still be added to new surveys. After four weeks, legacy AI coding will no longer be available to add to new surveys. By end of August 2026, full removal of legacy fixed coding, including for surveys copied from previous years.
Existing surveys, historical data, and results already collected are unaffected during the transition period. If you have specific benchmarking or year-on-year comparison needs that relied on fixed coding categories, speak to your account manager before the transition window closes.
Where to access it
AI open-text analysis is available now within the Reports area of any eligible survey. Navigate to an open-text question and select Generate analysis to trigger it. Analysis regenerates automatically when your survey closes.
It can be disabled at account, survey, or individual question level. You retain full control over where it runs. If you have questions about what this means for your existing surveys, your account manager is the right starting point.
The bottom line
The volume of qualitative data that events generate has always outpaced the capacity to analyse it properly. AI thematic and sentiment analysis does not replace the human judgment needed to act on insight, but it removes the bottleneck that has kept most of that data from being analysed at all.
For organisations that take event intelligence seriously, that is a meaningful shift. For a concrete example of how consistent event measurement feeds strategic planning decisions, read how IMEX turned data into a strategic planning engine.
Want to see this in action on your own event data?
A 20-minute walkthrough on the platform — tailored to your event portfolio, your stakeholders, and the questions your executives keep asking.